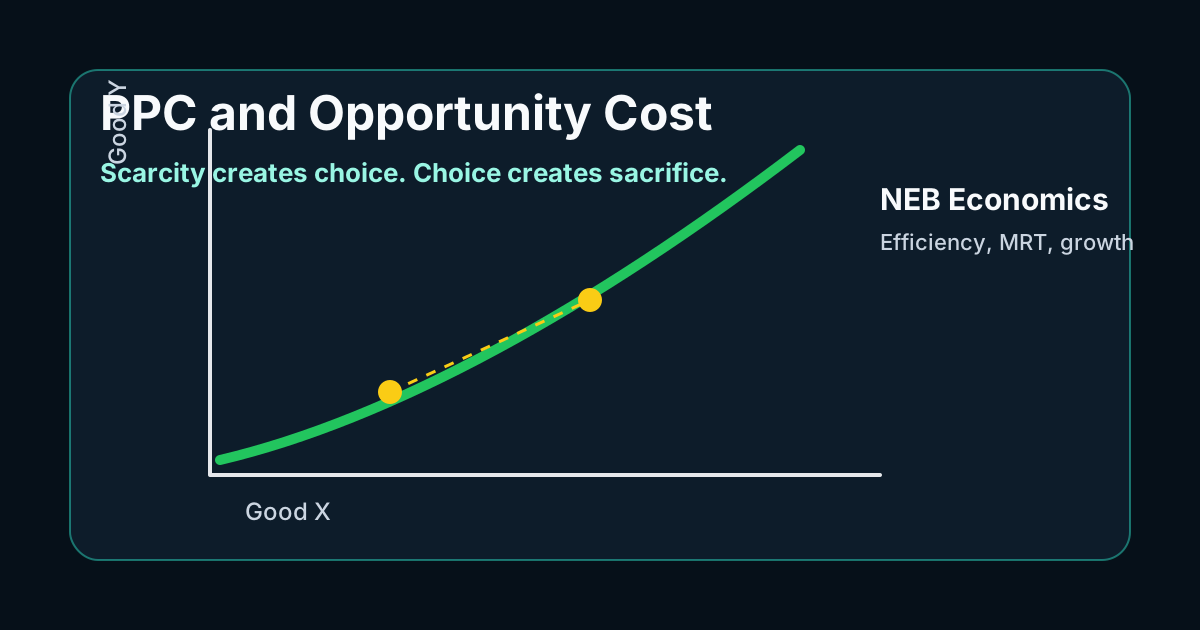
Complete NEB Grade 11 Economics notes on PPC, opportunity cost, MRT, efficiency, and shifts in the Production Possibility Curve.
The Production Possibility Curve, commonly called PPC or PPF, is one of the foundation topics of Economics. It shows the maximum possible combinations of two goods that an economy can produce when resources and technology are fixed and fully used. For NEB Grade 11 students, PPC is important because it connects scarcity, choice, opportunity cost, efficiency, unemployment, and economic growth in one diagram.
Human wants are unlimited, but land, labor, capital, and entrepreneurship are limited. Because of this scarcity, every society must decide what to produce, how much to produce, and what to sacrifice. The PPC gives a simple visual answer to this problem. If an economy wants more of one good, it usually has to give up some amount of another good.
In exams, PPC questions may ask for definition, assumptions, diagram explanation, opportunity cost, MRT, or reasons for a shift in the curve. A high-scoring answer should include a neat diagram, a short schedule, and a clear explanation of points on, inside, and outside the curve.
Exam Focus
Remember the chain: scarcity creates choice, choice creates sacrifice, and sacrifice is opportunity cost. PPC is the diagram that shows this relationship.
1. Meaning of Production Possibility Curve
A Production Possibility Curve is a graphical representation of different combinations of two goods that can be produced with given resources and constant technology. The curve shows the boundary between attainable and unattainable production levels.
For example, an economy may produce food and machines. If it uses more resources for food, fewer resources remain for machines. The PPC shows each possible combination and helps explain the cost of shifting resources from one use to another.
- It shows maximum production capacity.
- It explains scarcity and choice.
- It shows opportunity cost through movement along the curve.
- It separates efficient, inefficient, and unattainable points.
- It explains growth through an outward shift.
2. Assumptions Behind PPC
The PPC model is based on simplifying assumptions. These assumptions do not make the model useless; they help students understand the basic economic problem without unnecessary complication.
The main assumption is that the economy has fixed resources and constant technology during the period of analysis. The model also assumes that resources are fully employed and used efficiently.
- Resources remain fixed in quantity and quality.
- Technology does not change in the short period.
- The economy produces only two goods for simplicity.
- Resources are fully employed.
- Resources are not equally suitable for every use.
3. Opportunity Cost and MRT
Opportunity cost means the value of the next best alternative sacrificed when a choice is made. In PPC, opportunity cost is visible when the economy moves from one point on the curve to another point.
The slope of the PPC is called the Marginal Rate of Transformation. It shows how many units of one good must be given up to produce one additional unit of another good. In most real situations, MRT increases because resources are specialized.
Opportunity Cost = Sacrifice of the next best alternativeMRT = Change in Good Y / Change in Good X- A concave PPC shows increasing opportunity cost.
- A straight-line PPC shows constant opportunity cost.
- A convex PPC is unusual and shows decreasing opportunity cost.
4. Points on, Inside, Outside, and Shifts
A point on the PPC shows efficient production because resources are fully used. A point inside the PPC shows unemployment, underemployment, or wastage of resources. A point outside the PPC is impossible with current resources and technology.
The curve shifts outward when productive capacity increases. This may happen due to better technology, education, capital formation, or discovery of resources. The curve shifts inward during war, natural disaster, loss of workers, or destruction of capital.
- Point on PPC: full employment and efficiency.
- Point inside PPC: unemployment or inefficient use.
- Point outside PPC: unattainable at present.
- Outward shift: economic growth.
- Inward shift: fall in productive capacity.
Solved Example: Reading a PPC Schedule
Question: An economy can produce either 100 units of wheat and 0 machines, 80 units of wheat and 10 machines, 50 units of wheat and 20 machines, or 0 units of wheat and 30 machines. What happens to opportunity cost as machine production rises?
- When machine production rises from 0 to 10, wheat falls from 100 to 80, so the sacrifice is 20 units of wheat.
- When machine production rises from 10 to 20, wheat falls from 80 to 50, so the sacrifice is 30 units of wheat.
- When machine production rises from 20 to 30, wheat falls from 50 to 0, so the sacrifice is 50 units of wheat.
- Because the sacrifice increases at each stage, opportunity cost is increasing.
Answer: Opportunity cost increases as machine production rises, so the PPC will be concave to the origin.
Common Mistakes Students Should Avoid
Most students lose marks in this topic not because the chapter is impossible, but because they write incomplete definitions, skip the reasoning step, or present the answer without a proper structure. The following mistakes are easy to avoid if you revise with a checklist.
- Writing only the definition and forgetting to explain opportunity cost.
- Drawing a curve without labeling both axes.
- Confusing a movement along PPC with a shift of PPC.
- Saying every point inside PPC is impossible; inside points are possible but inefficient.
- Forgetting to mention that points outside PPC can become possible after growth.
A strong board-exam answer should move from definition to explanation, then to example, formula, diagram, table, or application depending on the subject. Avoid writing a single large paragraph. Use headings, underline important terms, and keep every calculation or argument connected to the question asked.
- Start with a one-sentence definition of PPC.
- Draw a clean curve using two goods on the axes.
- Explain points on, inside, and outside the curve.
- Use one example of opportunity cost.
- End with the importance of PPC in explaining scarcity and choice.
Practice Questions for Revision
Use these questions after reading the guide. First try answering without looking at the explanation, then compare your answer with the structure above. This method builds recall and improves exam presentation.
- Define PPC and explain its assumptions.
- Why is PPC concave to the origin?
- Explain opportunity cost with the help of PPC.
- Differentiate between movement along PPC and shift in PPC.
- What does an outward shift of PPC indicate?
Frequently Asked Questions
What is PPC in simple words?
PPC is a curve that shows the maximum possible combinations of two goods an economy can produce with fixed resources and technology.
Why does PPC slope downward?
It slopes downward because producing more of one good requires sacrificing some amount of the other good.
What does an inward shift show?
An inward shift shows a fall in productive capacity caused by disaster, war, resource loss, or decline in technology.
Conclusion
The Production Possibility Curve is not just a diagram; it is a compact explanation of the central economic problem. It helps students understand why scarcity forces choices and why every choice has a cost.
For NEB exams, master the definition, assumptions, diagram, MRT, opportunity cost, and shifts. If you connect these ideas clearly, PPC becomes one of the easiest long-answer topics in Economics.